
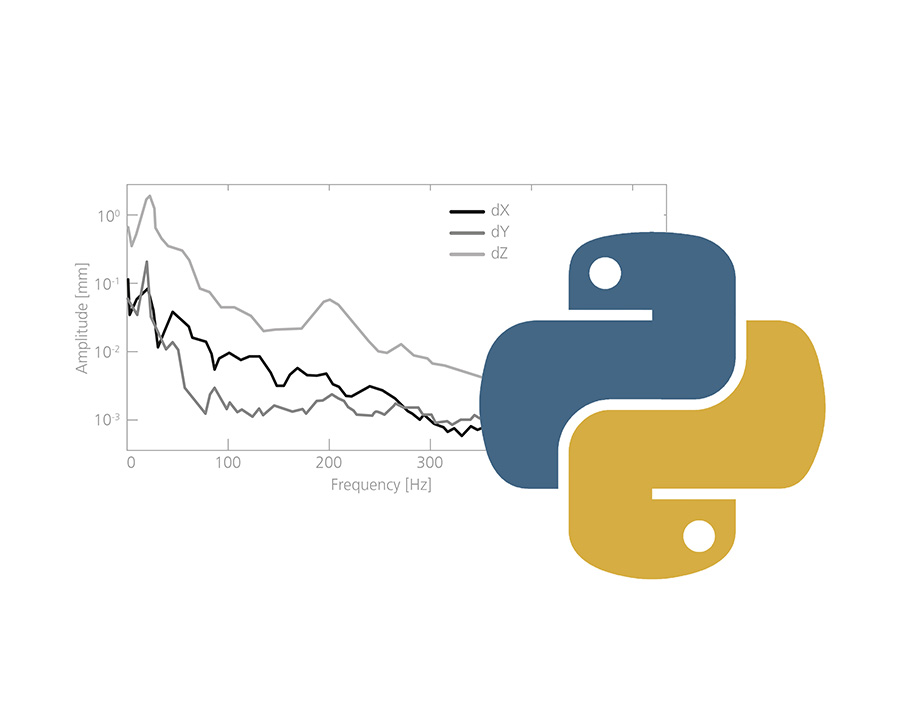
GOM Correlate Professional 2018 offers fast and simplified data access for complex scientific computations using Python. Freely available Python libraries, such as NumPy, SciPy or Matplotlib, can be easily used with an external Python installation in GOM Correlate Professional 2018. Thus, both computations and diagrams can be created directly, which are necessary for, for example, vibration analyses (FFT) and tensile tests.
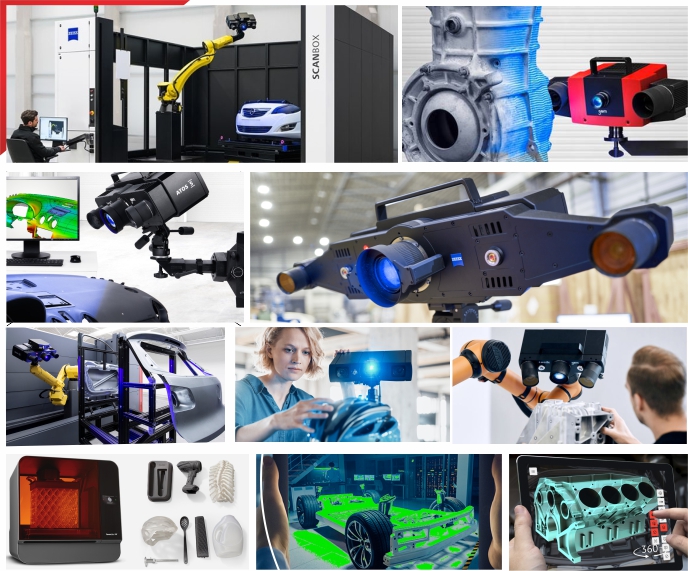
GOM Correlate
Evaluation Software
for 3D Testing
Digital image correlation
3D motion analysis
Share measuring results
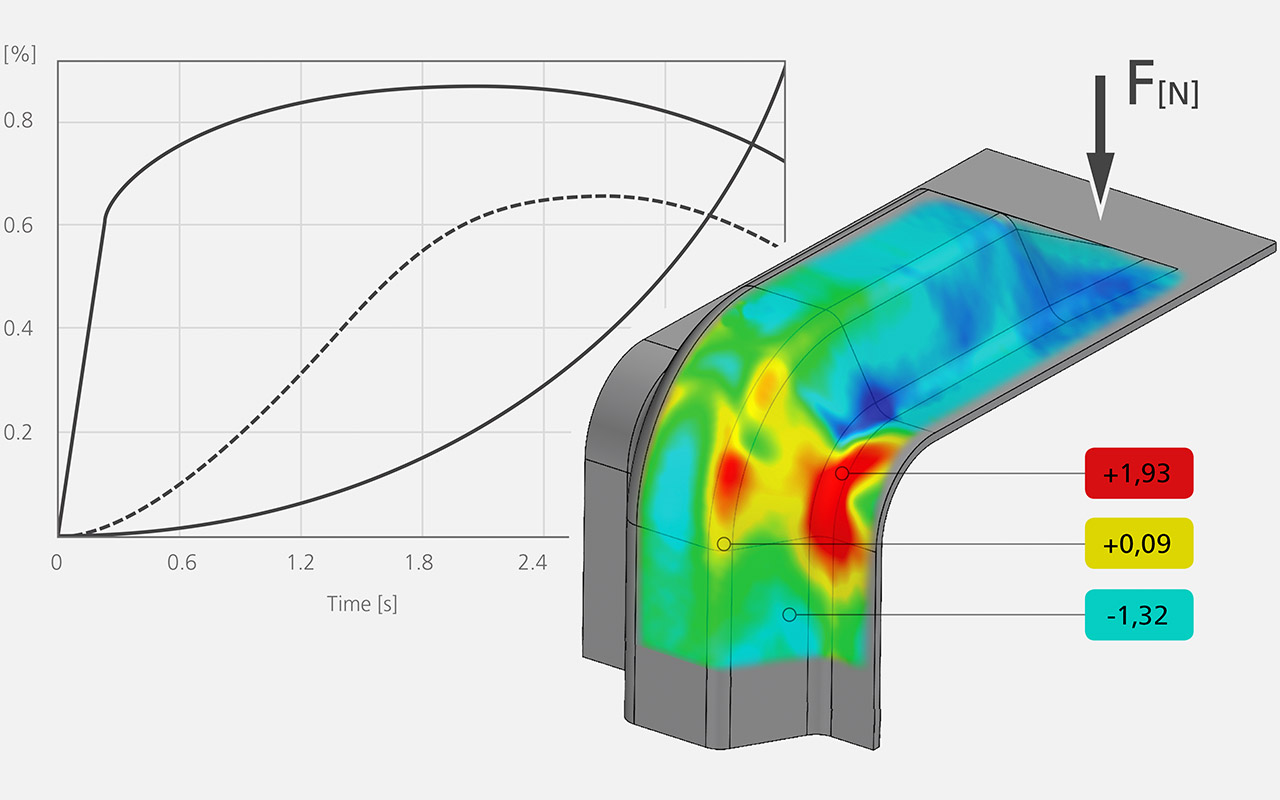
Efficient, Process-Based Python Interpreter
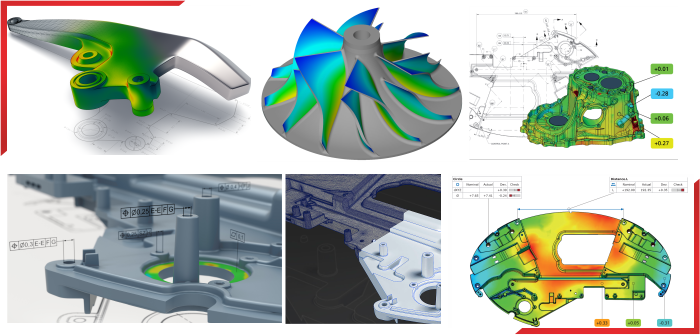
Improved Representation of Deviations in the 3D View
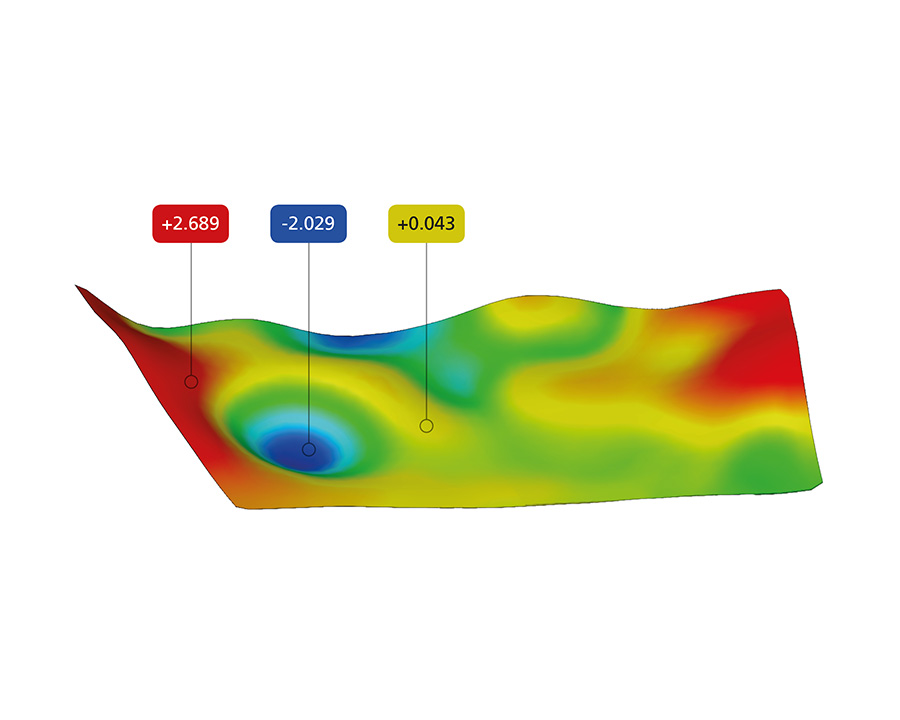
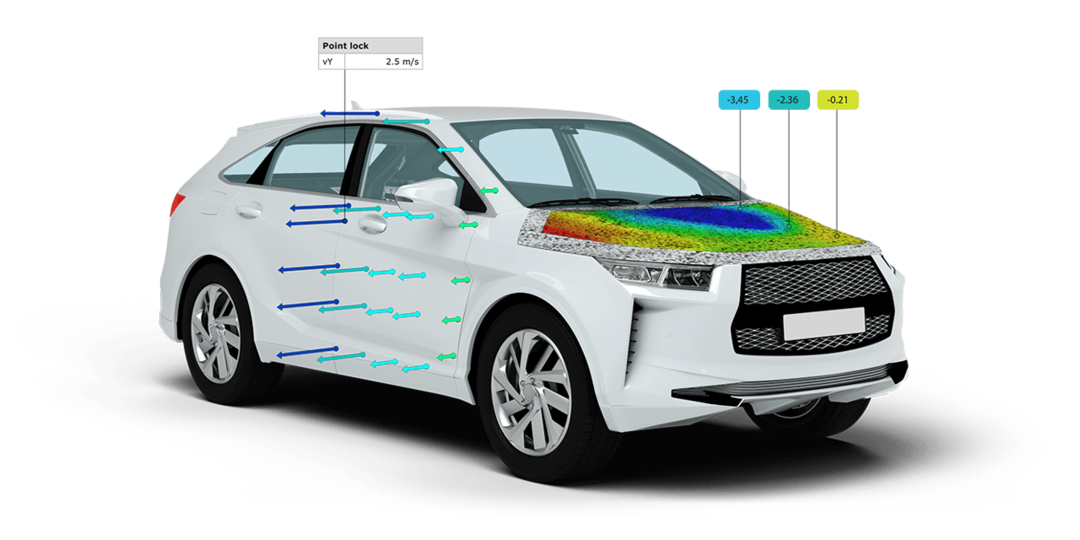
In addition to the two-dimensional deviation representation, deformations, such as bulges, dents and depressions, can be displayed excessively in the 3D view and thus can be displayed plastically. Scalar values can be transformed accordingly into a kind of a height map. Moreover, the direction of Euclidean displacements on surface components can be displayed using arrows. Thanks to the extended visualization options, the user can interpret the results even faster and easier.
Open Data Exchange
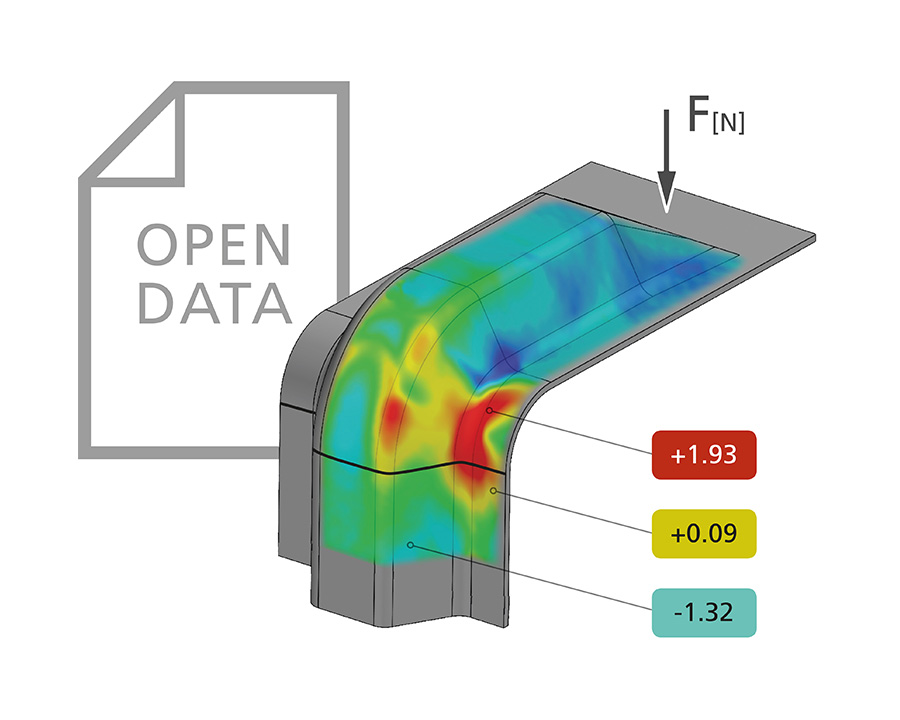
The exchange of data is becoming more and more important in metrology. For example, all relevant elements, such as sections, curves and coordinate systems, can be quickly exported in one or more stages as a CSV or XML file. Furthermore, any additional information, such as temperatures, can be linked not only with surface components, but also with point and facet point components. This data can then be further processed in the usual workflow.
© 2022. APM Technologies 3D Pvt Ltd
Copyright © 2022. All rights reserved